What are Moving Averages?
Susan Kelly
Sep 28, 2022
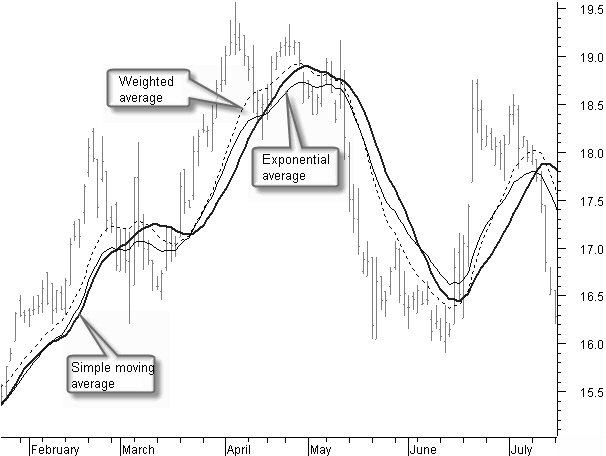
Moving averages are a technical indicator that displays how prices have moved on average over a predetermined period. They are typically used to assist in identifying trends, detecting trend reversals, and generating trading signals. There are many distinct variations of moving averages to choose from. Each of them draws a line on the chart, which might point you in the direction in which a price is moving.
Simple Moving Average
Because it is simple to analyze, the simple moving average, often known as the SMA, was widely used before the invention of computers. Because of the increased computing power available today, it is now simpler to determine additional forms of moving averages and technical indicators. The average closing prices for a certain period are used to determine a moving average, which is then computed. When calculating a moving average, daily closing prices are the most common choice; however, it is possible to utilize different periods.
Alternate forms of pricing information, such as the opening price or the median price, may also be used. After the current price period, that data is added to the computation while the oldest price data in the series is deleted.
Weighted Moving Average
WMA provides a weighted average of recent prices, with the weighting decreasing with each prior price. This allows the WMA to reflect more accurately changing market conditions. This operates similarly to the EMA, but you compute the WMA differently. Depending on the number of periods used in the computation, various weights may be ascribed to WMAs. If you are interested in calculating the weighted moving average of four distinct prices, the most recent weighting might range from 4 to 10. The prior session may have been worth 3 to 10 points. The weighting for the third quarter might range anywhere from 2 to 10.
For instance, weighting 4 to 10 indicates that you have ten recent periods with their pricing. You pick the four rates that were most recently listed. This contributes forty percent to the overall value of the WMA. The price can account for only ten percent of the WMA value from four times ago.
Moving Exponential Averages
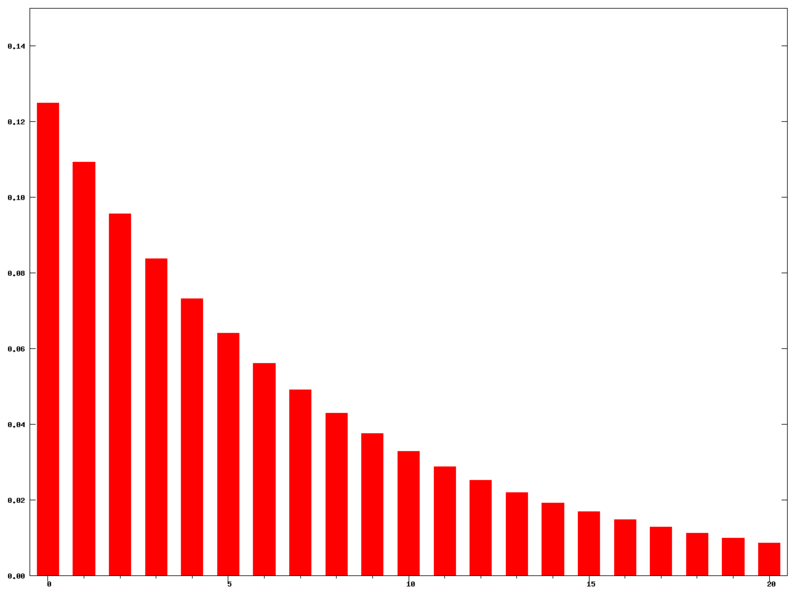
The most recent prices are likewise weighted more important in the calculation of MAs, although the rate of decline between one price and the price that came before it is not always the same. The difference in the decline is becoming smaller at an exponential rate. There may be a difference of 1.0 between the weights of the first two eras, a difference of 1.2 between the weights of the two periods that come after those two periods, and so on, instead of each previous weight being 1.0 less than the weight that came before it.

Which Type of Moving Average Produces the Best Results?
Some people feel that EMA is a superior indication of a trend compared to a WMA or SMA. An EMA utilizes an exponentially weighted multiplier to give greater weight to recent prices. Some people believe that the EMA is more sensitive to shifts in fashion trends. On the other hand, because of its more fundamental smoothing, the SMA may prove to be a more useful tool for locating simple support and resistance regions on a chart. In general, moving averages are used to smooth out pricing data, which may be visually noisy without them.
The functions of an EMA and a WMA are comparable; however, they emphasize the most recent prices and accord earlier prices a lower level of importance. Traders may utilize Exponential Moving Averages (EMAs) and Weighted Moving Averages (WMAs) instead of Simple Moving Averages (SMAs) if they are worried that the impact of delays in the data would limit the responsiveness of the moving average indicator.

One major disadvantage of all moving averages is that they are lagging indicators. Moving averages suffer a time lag before accurately representing a shift in the overall trend since they are constructed using historical data. Before a moving average detects a trend shift, a stock price may have already made a significant move. Compared to a lengthier moving average, a shorter moving average experiences less lag.
Nevertheless, this lag is helpful for technical indicators such as moving average crossings since it allows for more accurate predictions. The death cross is a technical indicator when the 50-day simple moving average (SMA) exceeds the 200-day simple moving average (SMA). This is seen as a negative indication. When the 50-day Simple Moving Average (SMA) crosses above the 200-day SMA, an opposing indication known as the golden cross is generated. This indicator is regarded to be a positive signal.


